
APPLICATIONS / SERIAL PASSAGE
What is a Serial Passage Experiment?
Serial passage is a process designed to maintain microbial cells growing exponentially between two user-defined optical densities (ODs). This type of experiment is well suited to determine culture growth rates and for evolutionary studies.
Serial passage experiments can be implemented easily using Ogi3’s turbidostat function in conjunction with user-scripting to modify the standard single OD threshold turbidostat to instead run with two different optical density (OD) thresholds.
When the culture’s optical density reaches the specified upper OD threshold, the culture is automatically diluted with fresh media, and biomass removed, until the OD falls below a lower OD threshold. The dilution is then paused to allow the culture to grow in batch conditions until it once again reaches the upper OD threshold.
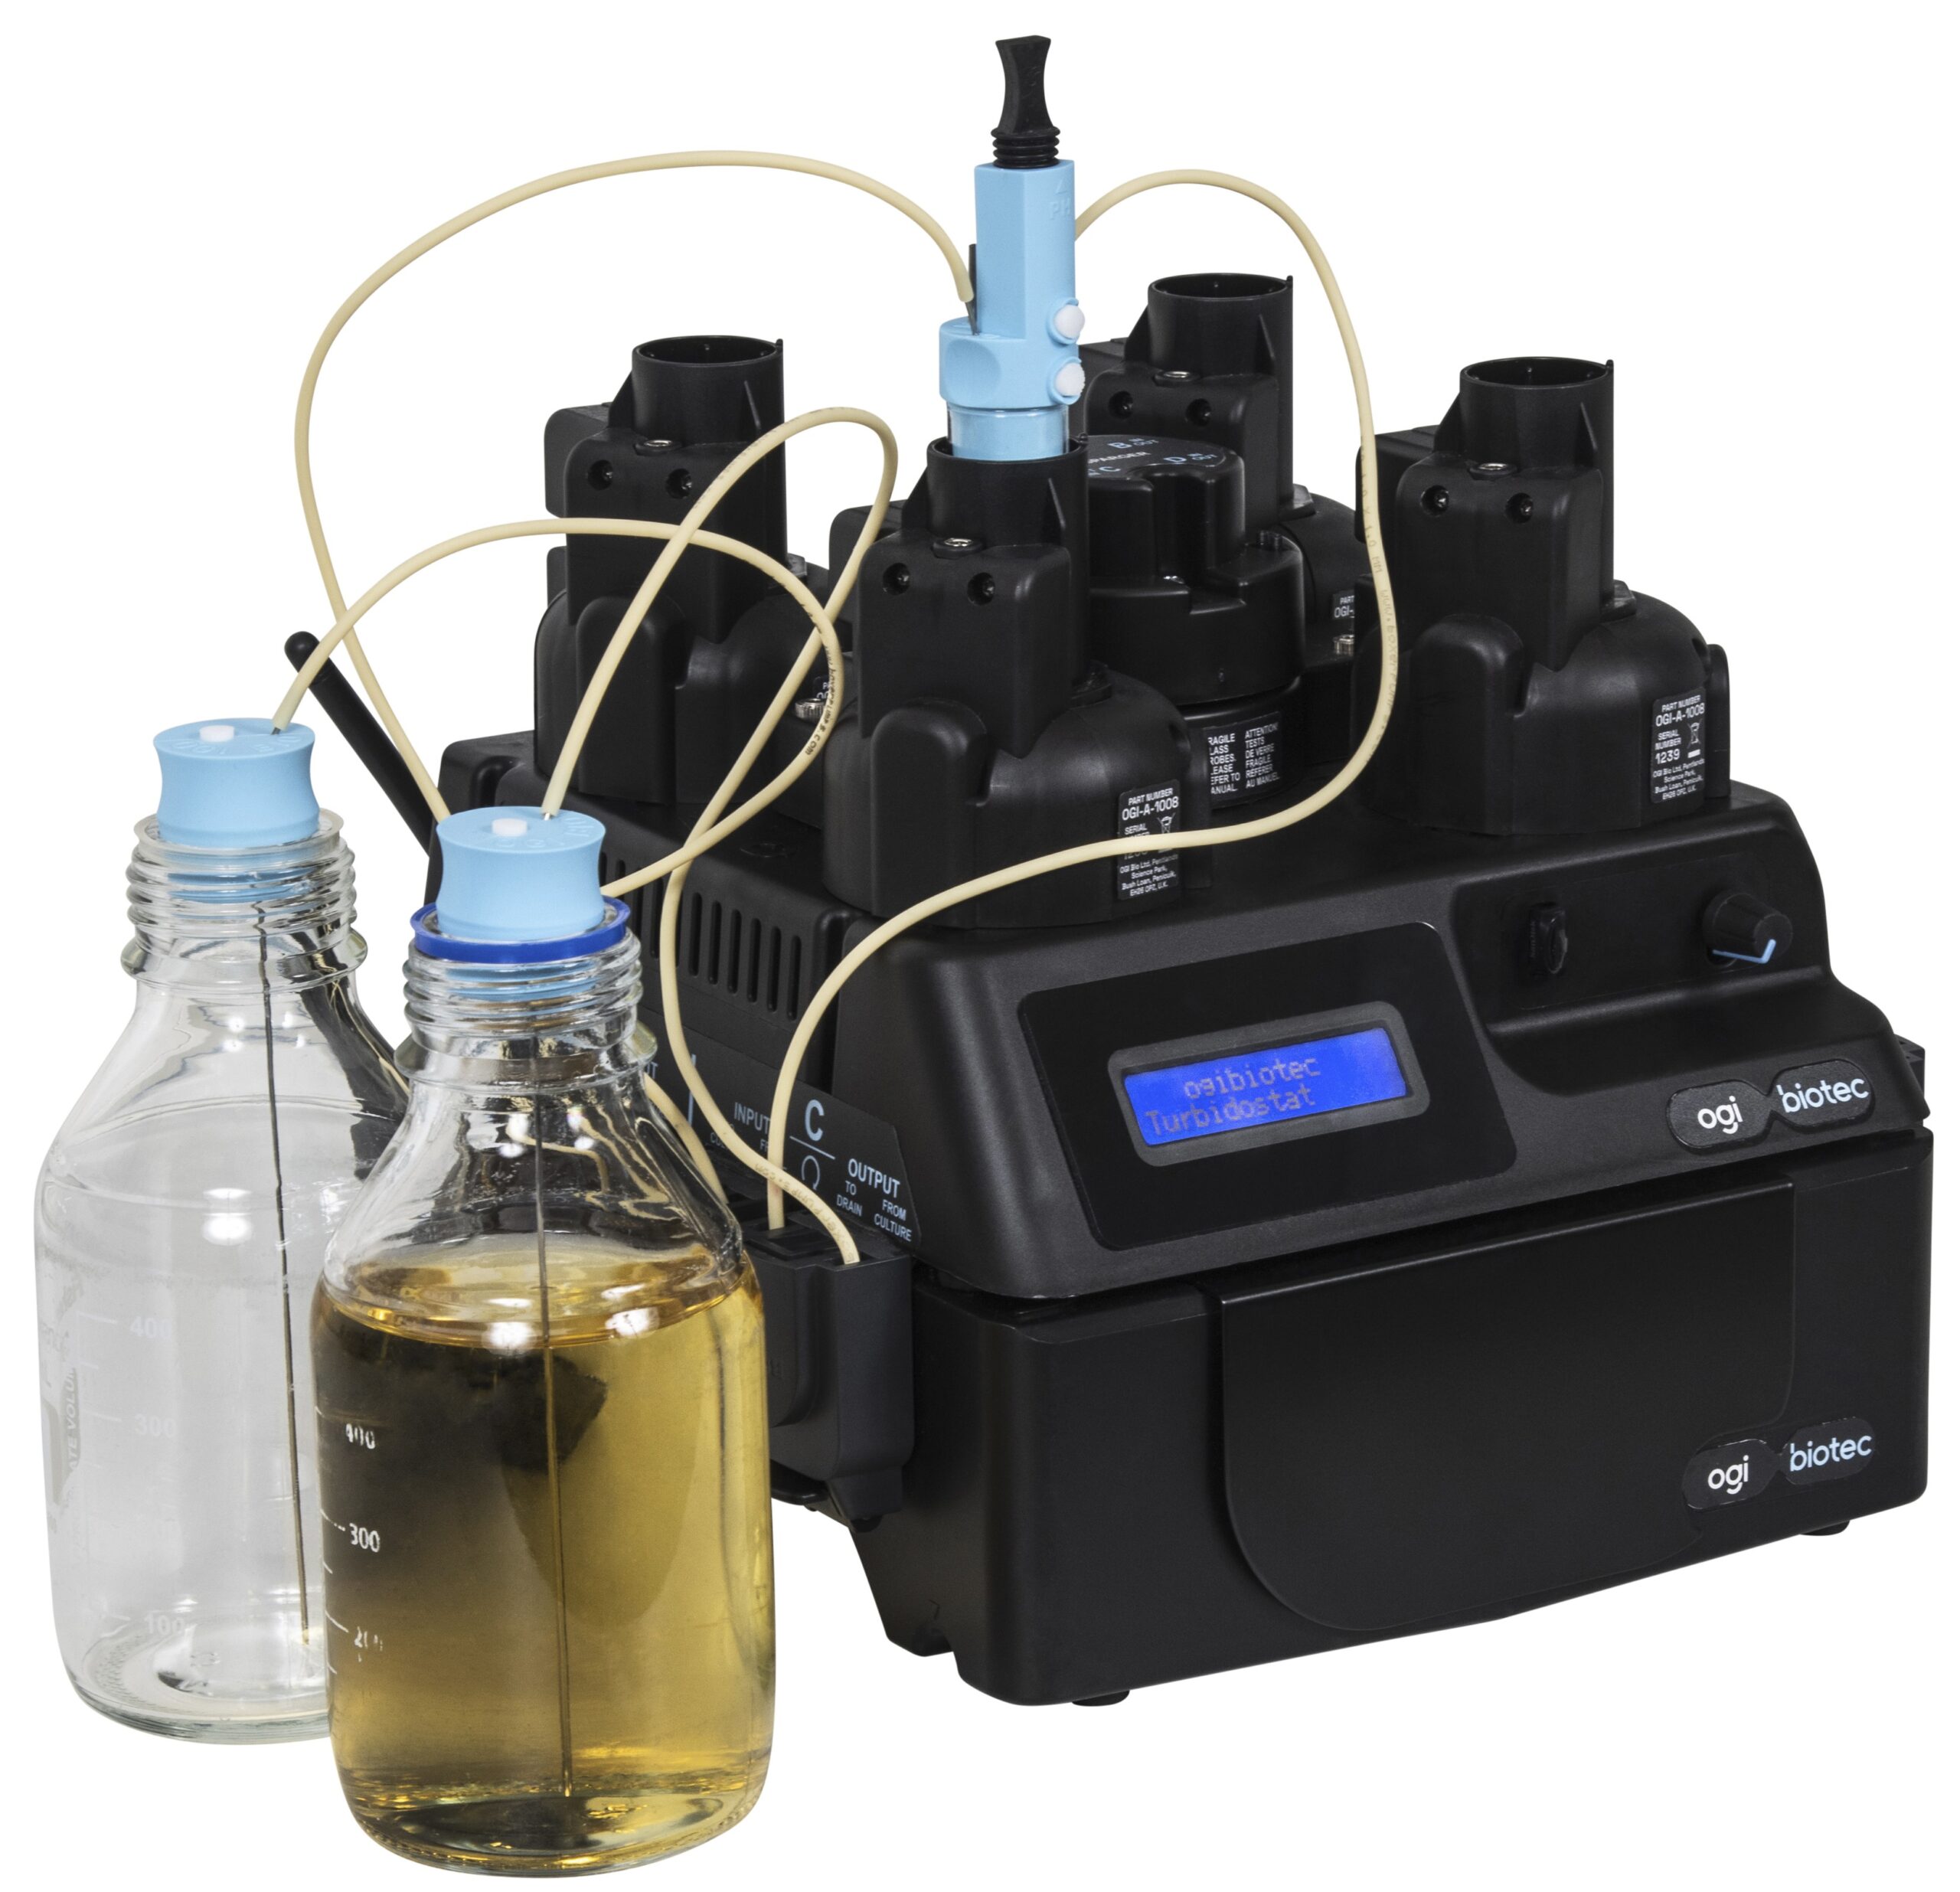
Serial passage experiments can be performed without human intervention for multiple cycles and also include process changes as desired with a single Ogi3 bioreactor performing up to 4 separate serial passage experiments at the same time.
Why use a Serial Passage Experiment?
Understanding how the rate of growth of your organism is impacted by process conditions is a key part of screening media, strains and process optimisation.
Monitoring growth rates in shake flasks is incredibly time consuming requiring many flasks and different incubators to produce data that is, despite the huge effort, relatively low resolution.
A similar problem exists when researching microbial evolution using serial passage (e.g. Richard Lenski’s famous Long-Term Evolution Experiment).
Ogi3 automates this process to condense multiple flasks and many hours of manual work into one longitudinal experiment to produce richer, more robust data without the risk of culture contamination.
How can serial passage be implemented using Ogi3?
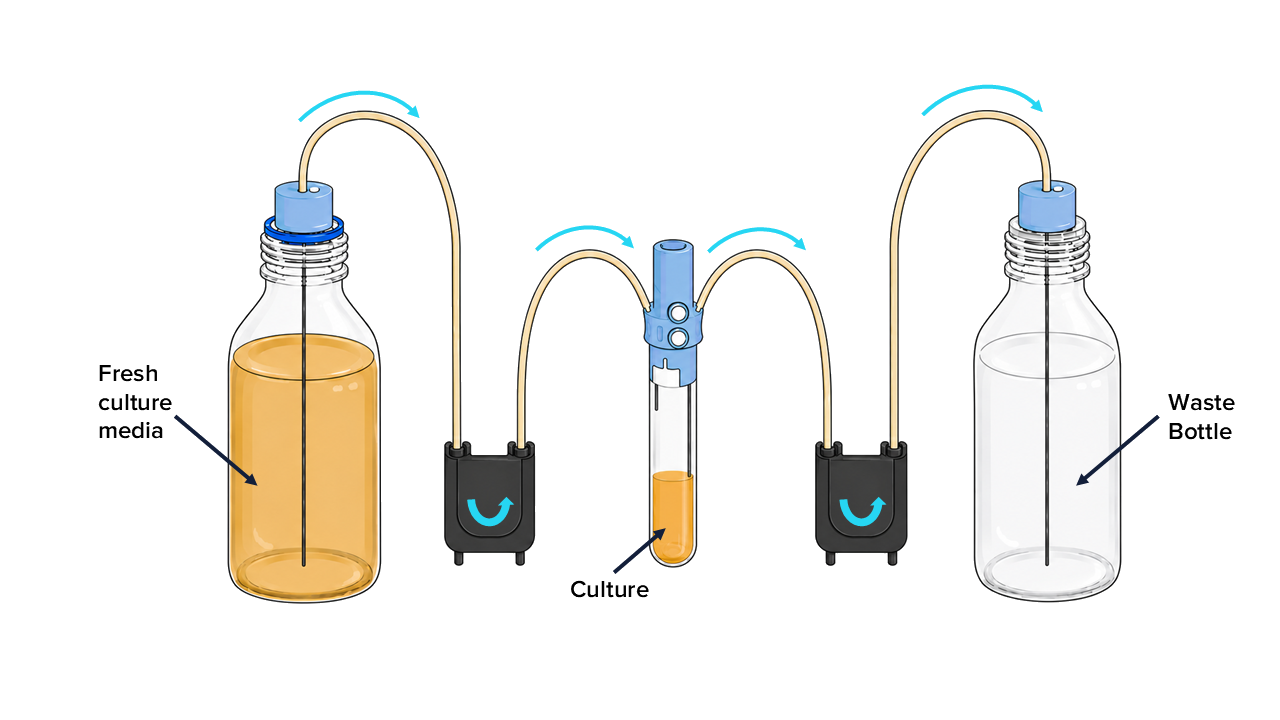
The required experimental setup is the same as for the turbidostat (see above). The biggest difference to the standard turbidostat experiment is that the user must run a control script on a laptop/PC connected to Ogi3 via USB. An example script implementing serial passage can be found in our github repository.
For each culture flask the user can define an upper and lower OD threshold within the script. When the experiments begin they start as regular turbidostat experiments with the threshold ODs set to the upper OD which the user does not wish to exceed.
As the culture grows the OD for each flask is periodically measured, typically every 3 to 5 minutes, until the OD reaches the upper OD threshold at which point the script switches the turbidostat OD threshold to the lower OD value, which can be very close to zero. This immediately activates the feed and drain pumps to add fresh culture media while removing excess volume. This action reduces the cell density in the culture flask until the OD of the culture reaches the defined lower OD threshold while maintaining the volume of 15 mL in the reactor flask.
Once the lower threshold has been reached, the script again changes to use the upper OD threshold as the target. The culture continues to grow and the whole cycle repeats itself until the user stops the experiment.
Between dilutions the cultures grow essentially in a batch culture mode. If the upper OD thresholds are defined at ODs where the cultures grow exponentially at all times then the growth rates can be easily calculated from the produced growth curves.
In addition to performing technical replicates in series, changes to the culture conditions can be easily implemented during the course of the experiment by introducing modifications to the script. This allows the researcher to, for example, explore the impact of changing growth conditions on the rate of growth. As an example, let us consider the below serial passage experiment with E. coli MG1655 in LB, in which temperature was increased from 30°C to 37°C:

The above plot shows the optical density versus time. During each dilution cycle, the culture grew from OD=0.1 to OD=0.4. During the growth phase, the OD was measured every 5 minutes as shown by the black dots, providing 12 OD readings for each growth cycle. Note that during the dilution phase the OD readings are more frequent. However, this part of the curve has no biological significance.
The impact of temperature on the growth rate can be quantified by fitting an exponential function (dashed lines) to the data. This yields the following plot, clearly demonstrating how increasing the temperature increases the growth rate:

Any of the process parameters, such as stirring speed and pH, could also be adjusted to assess the impact. Additionally, the script can be modified to automatically change/make an addition to the culture at a defined time point. The example below shows the OD vs time plot from a “media switch” experiment: glycerol (the sole carbon source) being replaced by glucose after ~31 hours as indicated by the arrow:

In this case, OD thresholds were set to OD=0.2 and OD=0.3. Note that glycerol had to be passively diluted out in this experiment, hence the culture was exposed to both sugars for a few hours. Nevertheless, the difference in the rate of growth on glycerol vs glucose is clearly visible in the below plot.

Want to find out how you could use a serial transfer experiment?
What else can an Ogi3 do?
Chemostat
Provide a consistent growth environment for your cells by continuously feeding them with fresh culture media.
Batch Culture
Automate the experiments you’re doing in shake flasks with the added real time analytics and control you need to get robust datasets with minimal hands-on time to maximise your productivity.
Morbidostat
Automatic and dynamic stressing of cells for Directed Evolution (DE) / Adaptive Laboratory Evolution (ALE) experiments
Turbidostat
Hold your culture at the required point in their growth for your experiments with high frequency OD measurement and automated dilution
Build the perfect OGI3 for your experiments
OGI3 Bioreactor
Four independent bioreactors with precise control over stir speed, temperature, and optical density measurements.

Liquid Control Module
Effortlessly manage your liquid cultures with ogibiotec’s liquid control module.

Fluorescence Module
Enables real-time full spectrum scan of 340 to 780 nm in 2 nm increments.

pH Module
Monitor the pH in each culture. Ogi3 pH probes to allow the accurate measurement of pH 0-14.

Dissolved Oxygen Module
Measure the concentration of Oxygen in your cultures in real time.

Sparging Module
Provide additional gas to your cultures via headspace or dip-tube sparging. Supplied with pre-humidification units.

NB: Images not to scale